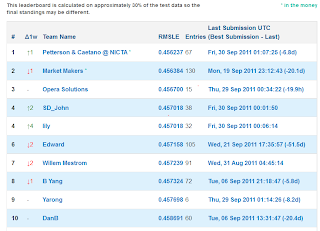
There have been some recent announcements on Kaggle reminding competitors about the rules regarding teams and that a single person can't have muliple accounts in order to get around the daily submission limit.
I used the HHP leaderboard as an interesting data source to educate myself on the data manipulation capabilities in R and it became very evident that there was some curious behaviour going on.
From a data scientist viewpoint, this demonstrates the power of the human eye in picking up things that will give you the insight that an algorithm won't. In most (probably all) of my professional projects the important data issues and findings have been a result of looking at visualisations of the data and asking the question "what's going on here!".
The first curiosity on the leaderboard was by trying to discover if the competition was attracting new entrants by looking at the dates of the first submissions of entrants. The two plots below show different ways of looking at the same data. What is obvious is that the 29th Nov had an unusual number of new entrants.
and looked at in another way...
What's going on here?
If you look at the team name of the entrants it is clear that all these accounts are somewhat connected - so no real mystery as to the cause of the blip for this date.
"accnt002" "accnt003" "accnt004" "accnt005" "accnt006"
"accnt007" "accnt008" "accnt009" "cyclops" "Faber"
"Farbe" "Fortis" "glad5" "glad55" "gladiator"
"gladiator1" "gladiator2" "gladiator3" "jackie" "Kaggleacctk"
"KaggleK2" "sashik"
The next two plots show the scores of the first submission of teams.
What's going on here?
The common scores where the steps are seen are the all zeros benchmark, optimised constant benchmark and the code we posted in our writeup - so this is explained. There is another common first score which is another very simple model that many teams independently thought of.
What does raise an eyebrow from the cumulative plot is one team stands out as having a very impressive first score. This is team YARONG who posted a very impressive model of 0.457698 on the first attempt and it still remains their best score 22 attempts later. This is possible (you don't need to submit models to blend them if you have your own holdout set - see the IBM writeup in the KDD Cup Orange Challenge) but somewhat unlikely as we know from the writeups that an individual model will get you no where near this score.
If you look at the dates teams submit and look at some sort of correlation of entry dates, one team appears twice towards the top - SD_John, and they are also at the top of the leaderboard.
td.row td.col pairs correl
UCI-CS273A-RegAll Alex_Tot 27 0.9979902
rutgers HappyAcura 29 0.9978254
SD_John lily 34 0.9974190
Roger99 Krakozjabra 21 0.9956643
SD_John JYL 24 0.9950884
The_Cuckoo's_Nest NumberNinja 23 0.9931073
NumberNinja Chris_R 29 0.9924864
What's is going on here?
If you plot the submissions and scores you will see SD_John and Lily seem to perfectly track each other in both the days they submit, the times they submit and the scores they get.
And on one particular day they get exactly the same score within 5 minutes of each other...
SD_John and JYL seem to also track each other in submission dates. Interestingly JYL has a very similar profile to a member of Opera, and a little digging would suggest this is one and the same person.
So here we can hypothesize that SD_john, lily, JYL and Opera (and evidence also suggests many more teams) are collaborating in some way.
Interesting - all from following your nose, which is what good data mining is all about.
In conclusion, the top of the leaderboard is not really what it appears to be - which I hope will encourage others to keep trying.
The main reason for this investigation was to help me discover what R can do to manipulate data - and the answer is basically anything you want it to do. You first have to know what you want to achieve then do some Googling and you will find some code to help you somewhere.


Thanks for the post. I had no clue as to who are behind Opera Solutions. I had a feeling that SD_John might be from San Diego, but I didn't know that there is a company named Opera Solutions and that they have office in San Diego. Very nice investigation!
ReplyDeleteInteresting - so you thought that SD stands for San Diego, I hadn't thought of that. What made you suspect that?
ReplyDeleteExcellent investigative journalism.
ReplyDeleteBeing from the western United States, San Diego was also the first thing that came to my mind when I saw SD.
In any case, you did some very nice statistical sleuthing.
Nice work
ReplyDeleteThis is great! You are the very definition of a data miner Phil.
ReplyDelete