Monday, 30 May 2011

There’s more than one way to skin a cat

In a previous post we examined at the strange looking log function that we are supposed to minimise to win the $3 million HHP and showed that all errors are not equal with this metric.

For example, a difference of 0.1 between your prediction and the actual value is more severely punished if the actual is 0 than if the actual is 15. The point of this is because it is more important to know if the customer is going to go to hospital or not than knowing exactly how many days they will be in hospital.

Now this 'non-standard' way the model is being judged might cause issues if we are using standard algorithms that seek to minimise different error functions. For example, in linear regression, the algorithm seeks to find a solution that minimises the sum of the squared errors, with no regard for what the actual value is;


sqrt( ( pred - act ) ^ 2 )


So, does this mean that we have to come up with a new algorithm that seeks to minimise this specific log function, or is there anything else that can be done so that we don't have to reinvent the wheel? 

Now the error function we are asked to minimise is very similar,


sqrt(  (  log(pred+1) - log(act+1)  ) ^ 2  )


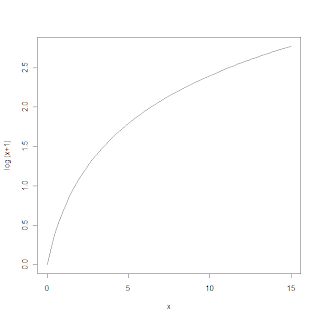
Note that the fact we have taken the log(act+1) is what introduces the issue that the magnitude of the actual value plays a part. The plot below shows x v log(x+1). A small change in x will give different changes in log(x+1) depending on what x was in the first place (ie the gradient of the line).


So, what to do?

If we look at the two equations above we can see that they are the same if we substitute

pred1 = log(pred + 1) and act1 = log(act + 1)


So, if rather than predict DIH, we predict log(DIH + 1), then we can use least squares minimisation, and use some standard algorithms that have already been developed for us. 

What we need to remember though is that when we make a submission we have put the prediction back on the right scale.

DIH_tran = log(DIH + 1)

DIH + 1 = exp(DIH_tran)

DIH = exp(DIH_tran) - 1

If we plot the data with these adjustments we can see how the error surface shows parallel lines, meaning all errors are equal, and least squares minimisation will work OK. When we put the errors back on the original scale, all errors are not equal. 


#############################################
# NOW ADJUSTING THE TARGET SO WE CAN
# MINIMISE THE RMSE
#############################################


# generate the data
dih <- seq(from=0, to=15, by = 0.05)

#adjusted days in hospital
dih1 <- log(dih + 1)
dat <- expand.grid(act1 = dih1, pred1 = dih1)

#adjusted error function
dat$err1 <- sqrt((dat$pred1 - dat$act1) ^ 2)

#'un-adjust' the days in hospital
dat$act <- exp(dat$act1) - 1 
dat$pred <- exp(dat$pred1) - 1

#plot the error on the adjusted scale
contourplot(err1 ~ act1 * pred1, data = dat
          ,region = TRUE
          ,cuts = 10
          ,col.regions = terrain.colors
          )
    
#plot the real scale
contourplot(err1 ~ act * pred, data = dat
          ,region = TRUE
          ,cuts = 10
          ,col.regions = terrain.colors
          )


Sunday, 29 May 2011

Hunting the Hidden Dimensions

Last week I came across a documentary on TV called 'Hunting the Hidden Dimensions'. Now generally there is nothing worth watching on Australian TV (unless you are into cooking or talent contests) but this one actually got me interested (although I must admit to falling asleep half way through due to the late for me time slot). 

http://www.sbs.com.au/documentary/program/huntingthehiddendimensions/index

The program was about fractals and the hidden order that appears in everything in nature. I didn't realise that fractal geometry was involved in film animation to generate mountain ranges and volcanic lava flow!

One thing that did strike an accord was how Mandelbrot, when he first published his work, got a bit of a thumbs down from the academic mainstream because the ideas didn't conform to the nice orderly nature of the world people were used to (ie the type of mathematics the Egyptians used to build the pyramids). The thing is, fractals are perfectly orderly, but looked at in a way that was different to the norm.

This is in a data mining context is similar to neural networks, with many people who should know better saying they are uninterpretable black boxes. When neural networks give improved predictions, they have found 'hidden dimensions' that are very easy to find if you are willing to look. Like Mandelbrot, you will need to look at data visually rather than mathematically in order to figure things out.

You can watch the documentary online. 


Saturday, 21 May 2011

Minimise the what?

The other week I was on Amazon to purchase Data Mining with R, and Amazon did some cross-selling, telling me I might be interested in ggplot2. Now I remember listening to a talk by Jeremy Howard, and seemed to recall he mentioned this book was worth a read, so I ticked the approproate box, and now the books are here.

I prefer looking at pictures to interpret information, so I wanted to see if I could use my new book to figure out what this log function was all about that the HHP prize people want us to minimize.

The following plots are all variations of the same data, plotted with different packages and functions. The generated data is basically what the errors would be for all possible combinations of Actual Days In Hospital v Predicted Days in Hospital.

Now generally, if you predict 15 and the real answer is 14, that is considered just as good as if you predict 2 and the answer is 1 - both have the same error - 1. Many methods of determining what is a good prediction, such as the mean squared error (MSE), don't care about the magnitude of the prediction, just the magnitude of the error.

Other metrics such as mean absolute percentage error (MAPE) do consider the magnitude. In electric load forecasting, if the actual load is 2MegaWatts (MW) and you have forecast 1MW, it can be far more serious than if the actual load is 900MW and you have forecast 899MW. In both cases the error is only 1MW but the consequences can be quite different.

So what does the error function of the HHP tell us?

Basically it says that we are penalised less for the same absolute error the higher the actual Days in Hospital is. So rather than concentrate on improving the prediction for someone who was 15 days in hospital and we only predicted 14 days, we would get far more reward by putting the effort into improving the prediction for someone who was 2 days in hosptal and we only predicted 1 day.

or...

a small improvement in accuracy for a small Days in Hospital is worth as much as a large improvement in accuracy for a large Days in Hospital.

Now all this insight was gleaned from just creating a graph. No Maths!


Now if we zoom in to what is the business end (remember 0.2 is a good guess) we see things are a bit more linear...


And here is what a we get for a normal type of error (just strip out the log and +1 from the data generation function). Note the lines are parallel.


and for percentage errors, note the lines are converging, similar to the log error, but the worse position to be in is making high predictions when the actual is low.


Here is the R code to generate the plots...


#############################################
# generate the data
#############################################

dih <- seq(from=0, to=15, by = 0.2)
dat <- expand.grid(act = dih, pred = dih)
dat$err <- sqrt((log(dat$pred+1) - log(dat$act+1)) ^ 2)
dat1 <- matrix(sqrt((log(dat$act+1) - log(dat$pred+1)) ^ 2),length(dih))


###########################################
# now plot the error surface of act v pred
# using several methods
###########################################
library(ggplot2)
library(lattice)
library(vcd)
require(grDevices) # for colours


### using ggplot2 ###
df <- data.frame(dat)
names(df) <- c("actual","predicted","error")

#version1
errplot <- ggplot(df, aes(actual,predicted, fill=error))
errplot <- errplot + geom_tile()
errplot <- errplot + scale_x_continuous(expand = c(0,0)) 
errplot <- errplot + scale_y_continuous(expand = c(0,0))
errplot

#version2
fill_gradn <- function(pal) {
  scale_fill_gradientn(colours = pal(7),limits = c(0,.5))
}
errplot <- errplot + fill_gradn(rainbow_hcl)
errplot


### using wireframe ###
wireframe(err ~ act * pred, data = dat
          ,scales = list(arrows = FALSE)
          ,drape = TRUE
          ,colorkey = TRUE,
          screen = list(z = 30, x = -60))
    
contourplot(err ~ act * pred, data = dat
          ,region = TRUE
          ,cuts = 10
          ,col.regions = terrain.colors
          )
    
    
## filled contour plot
filled.contour(x = dih, y = dih, z = dat1
                ,nlevels=10
                ,color = terrain.colors
                ,plot.title = title(main = "HHP Error Function (the funny log one!)",
                xlab ='actual DIH', ylab = "predicted DIH")
                ,key.title = title(main="Error"),
                )


Wednesday, 18 May 2011

State of the Union

80%+ of a dataminers time is normally spent manipulating the data so they can get to a point where they can start extracting insights. This data preparation is actually the most important part of the process where you should be most diligent.

Here is another example (to add to the one in the previous post) that demonstrates you don't always get what you think you should get.

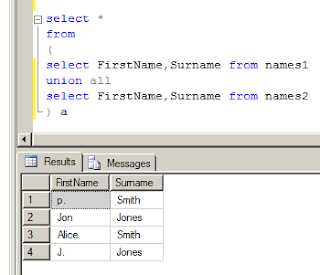
We have been supplied with two data sets of names and want to combine them into a single table. The UNION command will oblige us, but we have got to be very careful how we pose the question...

(This is MS SQLServer)


The result of this is not what we might think. Union seems to ignore the actual name of the field, so our firstnames and surnames are now all muddled up because they were in different column positions in each source table.

So to get what we really wanted, we can get the columns aligned first...


Don't assume the source data is consistent and the fields are in the same order in the database. Fortunately if you have lots of fields there is a way to check this...


If the field orders are not consistent, then it can be a pain explicitly typing out all the fields in your SQL statement to get the orders to match. Now there is also a time saver for this...


We can then just copy the result and paste it into our SQL to save us typing. 

Beware the Integers of SQL

Most data miners improve by learning from their mistakes. Many software programs have their own little quirks and sometimes deliver answers that are not quite the answers to the question you thought you were asking...


select AVG(DaysInHospital) from DaysInHospital_Y2
-- 0

select AVG(DaysInHospital * 1.0) from DaysInHospital_Y2
-- 0.467101

select SUM(DaysInHospital) / COUNT(*) from DaysInHospital_Y2
-- 0

select SUM(DaysInHospital) * 1.0 / COUNT(*) from DaysInHospital_Y2
-- 0.467101542670

Monday, 16 May 2011

Learning from the Leaderboard - Part 1

It is now day 12 of the HHP. I know this as I have been trying to make a submission every day, and the leaderboard says Sali Mali has made 12 submissions.

Dave is keeping his position near the top but Sali Mali is going downhill, as others overtake me.

I've now started to look at the problem in a little more detail, and decided I needed to a way of replicating the error function that is being used to judge this competiton. This will help in figuring out what sort of leaderboard score I expect my submissions to achieve. 

I've also not been totally wasting my submissions during the time when I have had no useful model to submit. In previous time series competitons, it has been possible to learn a lot from the leaderboard (real examples will be given part 2 of this post), so I figured pinging a few constant valued submissions might help me extract some insight about the future (although I've not really thought about what that insight might be at the moment).

The following R code demonstrates

  • how the function to calculate the error was put together
  • how we can easily generate the errors for a sequence of constant valued predictions on Y2 and Y3
  • how the Y4 leaderboard results were read from an Excel file and compared to the Y2 and Y3 results.
Doing this was a sanity check that my error function gave similar results to the leaderboard calculations. It shows that a constant of 0.2 is a good guess and also that the Y4 curve looks more  like Y2 than Y3. This is interesting and needs further thought on exactly what this means, if anything!


###########################################
#function to calculate the model error
###########################################
calc_error <- function(act,pred)
{
    aact <- as.matrix(act)
    ppred <- as.matrix(pred)
    
    if(nrow(aact) == nrow(ppred)){
    return (sqrt(colSums((log(ppred+1) - log(aact+1)) ^ 2) / nrow(aact)))
    } else {
    return (-99)
    }

}
#### EOF to calcualte model error ####


###########################################
# function to calculate the model errors
# given a sequence of constant values for
# the predictions and the known outcome
###########################################
err_seq <- function(sequence,act)
{
    
    actual <- as.matrix(act)

    #vector of errors
    errors <- vector(length=length(sequence))

    #vector for the predictions (will be constants)
    predictions <- vector(length=nrow(actual))

        ind <- 0
        for(i in sequence){
            
            #report progress
            ind = ind + 1
            cat("\n",i)
            flush.console()
            
            #set the prediction to the constant     
            predictions[] <- i    
            #calculate the error
            errors[ind] <- calc_error(act=actual,pred=predictions)
        }

    return (errors)
}
###EOF to calculate sequence of errors ####


#connect to data
library(RODBC) #for data connection
conn <- odbcConnect("sql_server_HHP")

#load the actual days in hospital
actualY2 <- sqlQuery(conn,"select DaysInHospital from DaysInHospital_Y2")
actualY3 <- sqlQuery(conn,"select DaysInHospital from DaysInHospital_Y3")

#set up a sequence of constants to be used as the predictions
const_preds <- seq(from=0, to=1, by=0.01)

#calculate the error sequences for Y2 & Y3
Y2Err <- err_seq(sequence=const_preds,act=actualY2)
Y3Err <- err_seq(sequence=const_preds,act=actualY3)

#read in the errors for Y4 from an excel file 
#where they were recorded
library(xlsReadWrite)
#this is also required to be run
#see http://www.swissr.org/software/xlsreadwrite
#xls.getshlib() 
Y4 <- read.xls("E:\\comps\\hhp\\constants.xls")


#############################
#plot prediction v error
#############################
ymin <- min(Y2Err,Y3Err)
ymax <- max(Y2Err,Y3Err)
plot(const_preds,Y2Err
    ,type='l'
    ,main='Learning from the Leaderboard'
    ,xlab='Predicted Constant'
    ,ylab='Error'
    ,ylim=c(ymin, ymax)
    ,col='blue'
    )
lines(const_preds,Y3Err,col='green')

#add the line for Y4, discovered via leaderboard
lines(Y4[,1],Y4[,2],col='red',lwd=2)

legend('bottomright', c('Y2 - known','Y3 - known','Y4 - via leaderboard'),lty=1, col=c("blue","green","red"))


Friday, 13 May 2011

Connecting R to our Database and Plotting Histograms

So far with the HHP I have 
  • loaded the data into a database
  • written an R script to check the submission file is correct, with the added bonus of plotting a distribution for a sanity check
 As yet I haven't even really looked at the data and don't really know what the problem is we are being asked to solve. But not to worry, all that will hopefully fall into place once we have our tools all set up and talking to each other.

 Data lives in a database, but it is no good to anyone if we can't get at it to analyse. It is possible to access this data, as the database developers have very genourosly provided what are called database drivers that allow these other applications to get to the data, and even change it if so desired. Many analytic applications have provided the means to utilise these drivers so the data can be sucked into their tools for analysis.

The task of connecting your applications to databases can be very painful if you are not really a database person and don't understand the lingo of what you are being asked to do. Some applications make it very easy (I have found Tableau remarkably painless and my own software Tiberius has instructions on how to do this) and some you have to Google around a lot find the answers to your questions. It is amazing how many products in their documentation just say 'contact your system administrator' - which is no help if it is you.

In the end though, once you have connected that is the biggest hurdle over, and then the world is your oyster.


So, we now want to connect SQL Server to R. First the code, then the detail.

Note: If you are viewing this in Internet Explorer or Chrome, you might get text wrapping in the code below and no horizontal scroll bar. If you are using FireFox then you get the scroll bar and no text wrapping. Either way you can still copy and paste the code OK. Another Damn Computer! 


# load the required libraries
library(RODBC) #for data connection
library(lattice) #for histograms

#######################################
# set up a connection to the database
#######################################

#method 1 - using a connection string
conn <- odbcDriverConnect("driver=SQL Server;database=HHP;server=PHIL-PC\\SQLEXPRESS;")

#method 2 - involves setting up a DSN (Data Source Name)
#conn <- odbcConnect("sql_server_HHP")


########################################################
# extract the data using this connection and some SQL
########################################################
mydata <- sqlQuery(conn,"select  * from DaysInHospital_Y2")
#mydata <- sqlQuery(conn,"select  * from Claims")


############################
# take a look at the data
############################
colnames(mydata)
head(mydata)
summary(mydata)


############################
# plot the distributions
############################

#set up the plot layout
maxplots <- 9 #upper limit on plots
plots <- NCOL(mydata)
plots <- min(plots,maxplots)
sideA <- ceiling(sqrt(plots))
sideB <- ceiling(plots/sideA)
cells <- sideA * sideB
#par(mfrow=c(sideA,sideB)) #use this for standard graphics
plotposition <- matrix(1:cells,sideA,sideB,byrow = T)

#draw all the plots
for(i in 1:plots){
myplot <- histogram(mydata[,i],main=colnames(mydata[i]),xlab='')
myposition <- rev(which(plotposition == i, arr.ind=TRUE))
print(myplot, split=c(myposition,sideA,sideB), more=TRUE)
}


The code above is R code and is run from R. It assumes you have the library RODBC installed. If you don't, then just type

install.packages('RODBC')

So, how do you get it to work?

There are 2 options to connect to the database, methods 1 & 2.

In method 1, you need to know 3 bits of information (you also might need user IDs and passwords depending on how access to the database is set up),
  1. the driver name (SQL Server in our case)
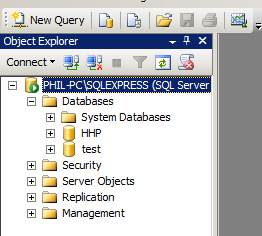
  2. the database server name. This can be tricky to remember. For SQL Server the easiest way to find it is when you start up the SQL Server Management Studio. In the picture below you will see the server name is PHIL-PC\SQLEXPRESS.


    There is one gotcha here. You will notice in the R script we have an extra '\'

    server=PHIL-PC\\SQLEXPRESS


    This is because '\' is a special charater in R, so you need to put two of them together to tell it that you really do mean '\'. This is useful to know when you have paths of files etc.


    Another thing to note above, we are in Windows Authentication mode, which means we won't have to worry with passwords.
      
  3. The name of the database in the database server that you want to connect to. You can discover your options from within the Management Studio. Here we have HHP and test

So when we string all this together we get,

conn <- odbcDriverConnect("driver=SQL Server;database=HHP;server=PHIL-PC\\SQLEXPRESS;")


Method 2 involves creating a Data Source Name (DSN), which can be thought of as the above bits of information but stored away somewhere in your computer, just wrapped under a name. With many applications, you just then have to specify this name to connect to the data.

On Windows machines, a DSN is created via a wizard that takes you through the steps. Here are instructions for XP.

The one Gotcha that I commonly encounter with SQL Server is that it tries to populate the list of available servers so you can just select it from a list, sometimes you can be waiting forever and you are not guaranteed to get your server in the list.


You can see above that it lists PHIL-PC, but this will fail, it needs to be PHIL-PC\SQLEXPRESS.

Also, if you are connected to a network, the list of servers could be pretty big and picking the one you need would be difficult to remember. If you do this often it can be worthwhile just having your common servers in a list and just pasting them in.

With the wizard, it can test the connection for you, so you know if your settings are correct.


The end result of all this is that we can connect R to our database and plot a graph. We can now get a sense of what the data is all about. Progress!

Interesting observations - Days in Hospital is mainly 0, then 1-5, with another hardly visible blip at 15.


hist(mydata$DaysInHospital[mydata$DaysInHospital > 1])


Interesting, obviously an anomaly in the data? Or maybe we should now start to read about the problem we are trying to solve and how the data has been put together.

We can just change the query to look at a different table in the database. The Claims data looks like this...


This gives us an idea of what we are dealing with. Now to  'shake rattle and roll!' 

Wednesday, 11 May 2011

Relevant Adds are Here!

I posted a piece on loading in the data, and now I see the adds appearing related to this. This is good, I even wanted to click on them myself to see what they were, but I resisted as I want the kitty to be non funded by me.


So click away boys and girls if you like the adds. I am $2 down today already as I went to the laundrette to dry my clothes (rained in Melbourne today) and put my $2 in the machine to get some change and all that came out was a flattened hearing aid battery.

Beware the HHP submission sort order

When a solution is submitted for the HHP, the file has to contain the memberID and the predicted Days In Hospital for year 4. 

It was noticed early on by a competitor that the memberIDs in the example file provided were not in numerical order, in fact they were quite random. Kaggle confirmed that the submissions had to be in the same memberID order as the supplied example file.

This now causes a concern, being as the data is now in a database. There is no real concept of row order in a database, just because you enter data in a particular order, there is no guarantee it will come out in that order. If you need a specific order, then the order by statement should be used in the SQL to specify the order required.

So how can we get the specified order?

We need to add a new column to the Target.csv file that contains the row order. A simple way to do this in Excel is just to add an extras column going from 1 to the number of cases, in ascending order.

Another way to create this extra column is to use R. When R reads data it conserves the order the file is read. The code below will create a new file with an extra column.


#########################################################
# the customer ID is not in any particular order in
# the submission file. This code creates a sort order
# that we can use to ensure things are sorted correctly.
#########################################################
setwd('E:\\comps\\hhp\\raw data\\HHP_release2')

#read in the original
Target <- read.csv('Target.csv')

#add an extra column called orderbyme
#with the row number as the value
Target$orderbyme <- 1:nrow(Target)

#take a look at the result
head(Target)

#write out a new file
write.csv(Target, file='Target_with_order.csv',row.names=FALSE,na = "")


(the syntax highlighting is not perfect for R, it is for Perl, but lets you see the comments easily)

Now if we load this into SQL Server with the rest of the data, we have a field we can always sort by.


 Once a submission file is generated, we can also double check it in R and plot the distribution to give it a sanity check.


#########################################################
# this R code reads in a submission file, checks it and
# plots the distribution of predicted days in hospital
#########################################################

#change this to the name of the submission file to check
file_name <- 'submission6.csv'

#the submission files and
#Target.csv should be here
setwd('E:\\comps\\hhp\\submissions')

#read in the files
sub_file <- read.csv(file_name, header=TRUE)
compare_file <- read.csv('Target.csv',header=TRUE)
 
#check the file has the correct number of rows and columns
if(nrow(sub_file) != 70942){cat('\n\n***invalid number of rows***\n\n')}
if(ncol(sub_file) != 3){cat('\n\n***invalid number of columns***\n\n')}

#check the example file
if(nrow(compare_file) != 70942){cat('\n\n***Target.csv is corrupted***\n\n')}
if(ncol(compare_file) != 3){cat('\n\n***Target.csv is corrupted***\n\n')}

#check the ids match
differences <- abs(sub_file[,1] - compare_file[,1])

if(max(differences) != 0){
cat('\n\n***IDs in wrong order***\n\n')
}else{
cat('\n\n***IDs are in the correct order***\n\n')
}

#check the range
if(max(sub_file[,3]) > 15){
cat('\n\n***you have predictions > 15 days!***\n\n')}

if(min(sub_file[,3]) < 0){
cat('\n\n***you have predictions < 0 days!***\n\n')}


#####################################
#plot the submission distribution
#####################################
num_bins <- 50
theplot <- hist(sub_file[,3]
    ,breaks=num_bins
    ,xlim = c(0, max(sub_file[,3]) + 0.1)
    ,main = paste("Distribution of ",file_name)
    ,xlab = "Predicted Days in Hospital"
    )

#the mean prediction
mean_pred <- colMeans(sub_file[3])

xpos = max(sub_file[,3]) * 0.5
ypos = max(theplot$counts) * 0.75
mytext = paste("Mean submitted DIH= ",sprintf("%.4f", mean_pred))
text(xpos,ypos,mytext,pos=4)


and this is what I  get for one of my submissions to date...


and interestingly if you change num_bins to 5,000, you get...


which will lead to some investigation why we get this funny distribution.


Tuesday, 10 May 2011

Some are saying this guy will win the #drflix prize

I suddenly started receiving emails saying I had a first visitor from Belguim, UK etc. What was all this about - I'd only told 2 people about this blog and was not ready to go public just yet.

A bit of data mining via the blog web stats pointed to twitter, and then I saw this on the HHP page next to the leaderboard. See the top post on the right hand side - I clicked on the link and was taken aback when it lead to this blog.


I'm not into twitter, so can someone explain what #drflix is?


The number of visitors is now 85 from 16 countries (about the same as the number of teams now entered) but the kitty is still empty, so I guess I need to start talking about data mining more to get some relevant adds. I'm also getting some error messages because of that web counter gadget, page loading slow because of video type things - it may have to go, when I get passed 100 visitors maybe.

As to who will win, Dave is looking pretty strong at the moment. He remains at the top - I knew I shouldn't have bragged to him about my early triumph. Meanwhile I am sitting at no. 23, tucked in the middle of the peleton.  Hope to tell you how I got their soon.


Damn Computers


MICROSOFT

Been having a few issues with my Windows 7 64 bit laptop. Basically the other day it decided to tell me not to switch it off as it was going to install 125 updates. After a few hours waiting everything finished, but some very useful software I had wrote using Microsofts very own compiler no longer worked. It did work once but it looked as if the font was Chinese, and in subsequent attempts it seemed to want to run as a service. This was odd as the very same executable worked fine on my 32 bit machine.

To try to solve this issue I recompiled on the 64 bit machine and everything seemed OK . To my delight it seems now that a single executable is all that is need to run on 32 and 64 bit machines, which is good. The new issue was that I compiled with a setting that says you need dot net 4, and my 32 bit machine didn't have that. Rather than make people have to install dot net 4, I tried to recompile with a setting that says you only need dot net 2, but when I changed this setting the compiler got stuck in some kind of neverending loop and didn't do anything.

The reason for saying this is that I am going to mention this software in future posts - but if you want to use it Microsoft decrees you will need to install the latest version of dot net, unless anyone can tell me how to solve this problem.


BLOGGER & FIREFOX

Another issue that I've had is with this blog. I tried to edit posts and again, the little circle wizzed around indicating that it was thinking, but and hour later it was still thinking. I also couldn't seem to get any love from the template settings options.

I was using Firefox, which had also recently updated itself, so thought I'd try to see if it was the browser. Being as the blog was a Google thing I thought I'd download Chrome. Now when I tried to goto the Chrome download page, I got the message from Google saying wait for the download  and the same wizzing circles, which also wanted to be there for hours. I suspect this is a Firefox anti Google thing. I then tried IE and everything works fine in that, so Microsoft have redeemed themselves a little.


RATTLE

The next issue I had was with trying to get Rattle to run in 64 bit mode. There are a few documented issues of things you need to check, but I tried them all but couldn't get it to work. I have it working in 32 bit R, but 64 bit would be nice. Rattle is a nice useful bit of data mining software that I will hopefully be mentioning at some point in this blog.


PGP Encription

I have recently had some Pretty Good Privacy put on my hard drive, which at first glance seems a pretty good idea if your computer contains valuable information.

Now for me, the valuable information is large datasets that can contain sensitive details you don't want to find make their way into the newspaper should you leave your laptop on the train. The software I mentioned earlier reads these data files, but what I am finding is that it will read the first 30,000 or so rows in a few seconds, but then grind to a really slow pace after that, which is bad when you have a few million rows.

In order to eliminate the fact that it might be a result of the new compilation of the software, I moved on of the datasets to a different drive that was not encrypted, and voila - it worked as expected.


Java & Eclipse

I was using SPSS (a tool that can do things with data) and was quite merrily putting together a model when the window quite rudely decided it was not playing.


Initially I suspected it was an issue with SPSS rather than something I had corrupted on my PC , especially when a colleague who had exactly the same PC and OS got the same problem. This was an issue for me, particualry as the blackout was unannounced and made you lose any unsaved work.

SPSS was redeemed when I also then discovered it happedned in another application, unfortunately for me the one that helped me get my expenses reimbursed. The common denominator was that the applications were both built on Eclipse.  All evidence pointed to the video drivers and java not being a happy couple.

I found there were some new drivers available for download and installed them. Hopefully this has fixed the issue, but as this issue happens unannanounced half way through some work, I have learnt to save things quite frequently, just in case it happens again.


Saturday, 7 May 2011

Progress - Loading the HHP Data

A little progress...

  1. My daughter made it through her first swimming lesson without needing a swimming nappy. This was mainly my fault as we had ran out and the lesson was too early to have time to go to the shop. Anyway, that should save me some cash, so maybe I will no longer need the full 3 million.
  2. I managed to find a way of posting code with syntax highlighting into this blog
  3. I managed to load the HHP data into a database
  4. I picked up some bugs and improved some of my software while doing 3).

So, now the details....

1) Well done Princess no. 3
(but please tell us where you hid the TV remote)


2) Highlighting Code in a blog

When you do data mining, you would generally at some point have to write some computer code that does stuff to your data. You will notice that when you write the code it generally turns nice colours to highlight things that make the code easier to interpret.

I will hopefully be doing lots of this and posting code snippets to this blog so others can get ideas or use the exact same code to try out  (not sure how this fits in with the rules of the contest, but lets go for it anyway). It would be nice if the code also coloured itself in the blog.

A Google search came up with this site http://tohtml.com/. You just paste your code in a window, select what computer language the code is written in, press a button and presto, it generates html code for you. You then just edit the html of your blog and paste it in, and should get something like this...

Sub IsThisRight()

    MsgBox (IsNumeric("50+"))

End Sub

and if you tweak the background colour by editing the html...

Sub IsThisRight()

    MsgBox (IsNumeric("50+"))

End Sub

and if the code is big you can put it in a window by wrapping a div tag around in.


Sub IsThisRight()

    MsgBox (IsNumeric("50+"))

End Sub


Now this is probably not the most elegant solution and the background colour of the code is lost outside the code window - but I'm sure that can be easily fixed - but it works for me at the moment, but open to other suggestions.

One Gotcha is that when you edit the html in Blogger it is too smart and wants to add extra tags and rearrange things for you. When I pasted the div code above, height and width were next to each other, but Blogger decided overflow and auto should go in between them.


A call for help - how do I set the default font in Blogger? I can't find the option anywhere.


3) Loading the HHP data into a database

Well, at last something related to data mining...

When you are doing analytics as a consultant, you get given data files in typically 3 ways.

  1. an Excel spreadsheet
  2. some other proprietary data file format such as SAS or SPSS
  3. a text file that is an extract from a database
 the Excel spreadsheet can be because of 2 reasons:
  1. Excel is the database used and where the raw data lives (worrying but very common)
  2. The person doing the extract extracted it from a database for you and then decided they were doing you a favour by putting in Excel to pretty it up (also worrying)

I've had the following explanations given to me...

"There were a few million rows in the database but I can only get 64,000 on each sheet of excel so it will take me a while to get it ready for you."
"I extracted it but had to put it in excel because I new some of the data was wrong so I manually edited it for you."
When you hear this, just take a deep breath and do a bit of hand holding.

You often get proprietary files sent, which basically means it can be a pain to open them if you don't have the proprietary software. These are generally binary files and are the ones that look like hieroglyphics when you try to open them in a text editor. Binary files are a more efficient format for storing and retrieving data.


The bog standard ascii text file extract is the most painless way to go, which is the way it works in Kaggle competitions. There are two ways you could get these files:

  1. fixed width
  2. character separated variables (*.csv files)
The data represents fields/variables/columns/features and rows/cases/examples. Text files are clever and know when there is a new row of data, but specifying which bit of data should be in which column is another matter.

In fixed width files, each column starts at the same place in each row. This is not necessarily best as you may have to do a lot of padding with blank spaces to get the columns aligned, which makes the file bigger. If all the data in each column has the same width, then you will get a smaller file as it saves having to put a delimiter character in there. They are also not particularly simple to load - these are the ones in Access where you have to click to tell Access where the columns need to go. The field names are also generally not on the first row, they are tucked away in some other field definition file.


CSV (C Separated Values) files put a particular character in each line to indicate where the column boundaries are.  There are a few rules on how the files should be generated (note: there used to be a wikipedia entry that said csv stood for character, not comma, but I can't find this anymore - but there is a new entry DSV.)

The common character is a comma (","), but using this is fraught with danger which can lead to your file not loading properly.


If you have a text field in your data where a comma is actually contained in the text, such as address ("1 Smith St, Melbourne")  the text field need to be "qu,oted" in order to determine that the comma is part of the data rather than a delimiter. If these quotes are not included your data will get stuffed up and will have to be extracted again. This happens very often.


Also, some countries use the "," as a decimal point, which can also complicate things (see here).


When receiving data, I always ask for pipe delimited (this is the pipe character  | ) files with no quotes around string fields. The pipe character is unlikely to be present in any text fields (as not many people actually know what it is) so is a fair choice for a delimiter. Not including quotes around text, although this is defined in the standard, is going to be more friendly to most software you will use. Tab delimited files are also another option.


Well, enough of the side track, back to the HHP data.


When you receive a delimited text file, I recommend you check it before you do anything - don't assume it has been extracted correctly. The check is simply counting that each row has the same number of delimiters. 


Now you could load it into Excel to eyeball and it might 'look right', but Excel won't deal with bad files, and your columns may become miss-aligned. I also don't trust Excel as it also seems to have a mind of its own sometimes and does things to data that you rather it wouldn't, and might not even realise it has done (try typing (22) into Excel, including the brackets. Dates are also a concern for me).

You can also load the data into numerous databases using the import wizards they provide. Now some will tell you there are issues, but not all.


Microsoft SQL Server is one example of a database that used to be good at checking things. I often got messages such as 'error at row 2,758,946' and the would go and check the file at this row and discover there was an issue. You would then have to correct that row, re-load, get the next error message, correct, re-load etc.


Now, in order to show you what the error message was, I tried running an example in Microsoft SQL Server 2008 R2. I used the data import wizard to load the following CSV file:


and this is what it did:


This is not what I was expecting. You will see column c, row 2 has the value 3,4. This is probably not what was intended.  Now the last time I used the import wizard, in version 2000, I'm sure it would have thrown an error, so beware version changes.


Anyway, data lives in a database, and there are many free ones available. Most of the major vendors offer free versions that have limitations on the size of the database, and there are also open source ones, see this list.


I am going to use MS SQL Server 2008 R2 which is free. It has a 10 gig limit per database, but you can create multiple databases and communicate between them, so unless you have a really massive file it should accommodate most needs. Installation from what I remember had a few tricky questions you probably will think 'what the **** is that on about' if you are not used to database lingo, but once installed it is a pretty user friendly tool.


In order to load the data, you can use the data import wizard, but this is not something I personally like. I like to run scripts, which are sets of instructions from a file, so you can readily reproduce your steps by running the script, without having to remember any manual things you did. Scripts also make you work completely portable and shareable with others so you can work in teams. As long as you have access to the raw data, you can email your bunch of scripts to your web-mail account, fly to the other side of the world and reproduce the exact steps without having to take your computer with you. This is also why it is nice to use software that is free and downloadable from the internet.


As I needed to frequently check files and automatically generate scripts to load the data, I wrote a tool (niftytools.exe, windows only) that has been a massive time saver. This checks the file, corrects dogy rows or removes them and generates the script to load data into SQL Server.

Here it is in use on the claims data,


and this is the script it generated for loading the data,


CREATE DATABASE HHP
USE HHP

CREATE TABLE Claims
(
    MemberID    int  -- varchar(8)  --integers starting with 0, could be text!
,    ProviderID    int  -- varchar(7)  --integers starting with 0, could be text!
,    Vendor    int  -- varchar(6)  --integers starting with 0, could be text!
,    PCP    int  -- varchar(5)  --integers starting with 0, could be text!
,    Year    varchar(2)
,    Specialty    varchar(25)
,    PlaceSvc    varchar(19)
,    PayDelay    varchar(4)
,    LengthOfStay    varchar(10)
,    DSFS    varchar(12)
,    PrimaryConditionGroup    varchar(8)
,    CharlsonIndex    varchar(3)
,    ProcedureGroup    varchar(4)
,    SupLOS    tinyint
)


BULK INSERT Claims
FROM 'E:\comps\hhp\raw data\HHP_release2\Claims.csv'
WITH
(
MAXERRORS = 0,
FIRSTROW = 2,
FIELDTERMINATOR = ',',
ROWTERMINATOR = '\n'
)

Note it has determined the maximum size the varchar (variable length character) fields need to be for optimal size, which makes the database as small as possible. It also determines what type of integer is most efficient. You will see that the tinyint is not coloured, which is because this is a relatively new datatype and the web page mentioned earlier that did this syntax highlighting obviously hasn't got it in its list of special words. I emailed the developer, so we shall see if it changes. Also the field name Year is highlighted because it as also a reserved word in SQL Server. When this happens it can be sometimes worthwhile renaming the field (just change the word Year to something else).


One other thing worth noting, there are comments starting with 

-- integers starting with 0

 It was noted on the HHP forum that the IDs in the submission entry example did not match the ids in the data. This is because they started with zeros, so whatever software was used to generate the submission example had treated them as integers and lost the leading zero. Thanks to this I was able to modify my nifty tool to generate warnings if this is the case, and if gives you an alternative if you want to treat the field as a character field, which will preserve the zero.

Leading zeros are sometimes important, as 003 and 03 are not the same, but would become the same if you treated them as integers. I learned this when I used to deal with address files that had postcodes beginning with 0.

Another 'bug' I discovered in my nifty tool was that "55+" passes the isNumeric test (try in an Excel macro - see the sample code at the top of this post) , when it is not really, and SQL Server won't accept it. This improved the tool again, and highlighted the fact that there was some data like this that would need to be closely examined later on.


Running the generated script will load the data and it can then be viewed (click on the image below to see how)


So we are on our way! All the data is in and we can take a peak at it to see what it looks like.

If you want to use niftytools to check and help load data then it is freely available. You will first need to download and install my Tiberius package, and then look in the program files folder to find it. Note you will need dot net 4 - see this blog post find out why.